|
 |
| |
สอบถามวิธีสร้าง กราฟ หลายๆ กราฟและวนลูปในหน้าเดียวหน่อยครับ |
| |
 |
|
|
 |
 |
|
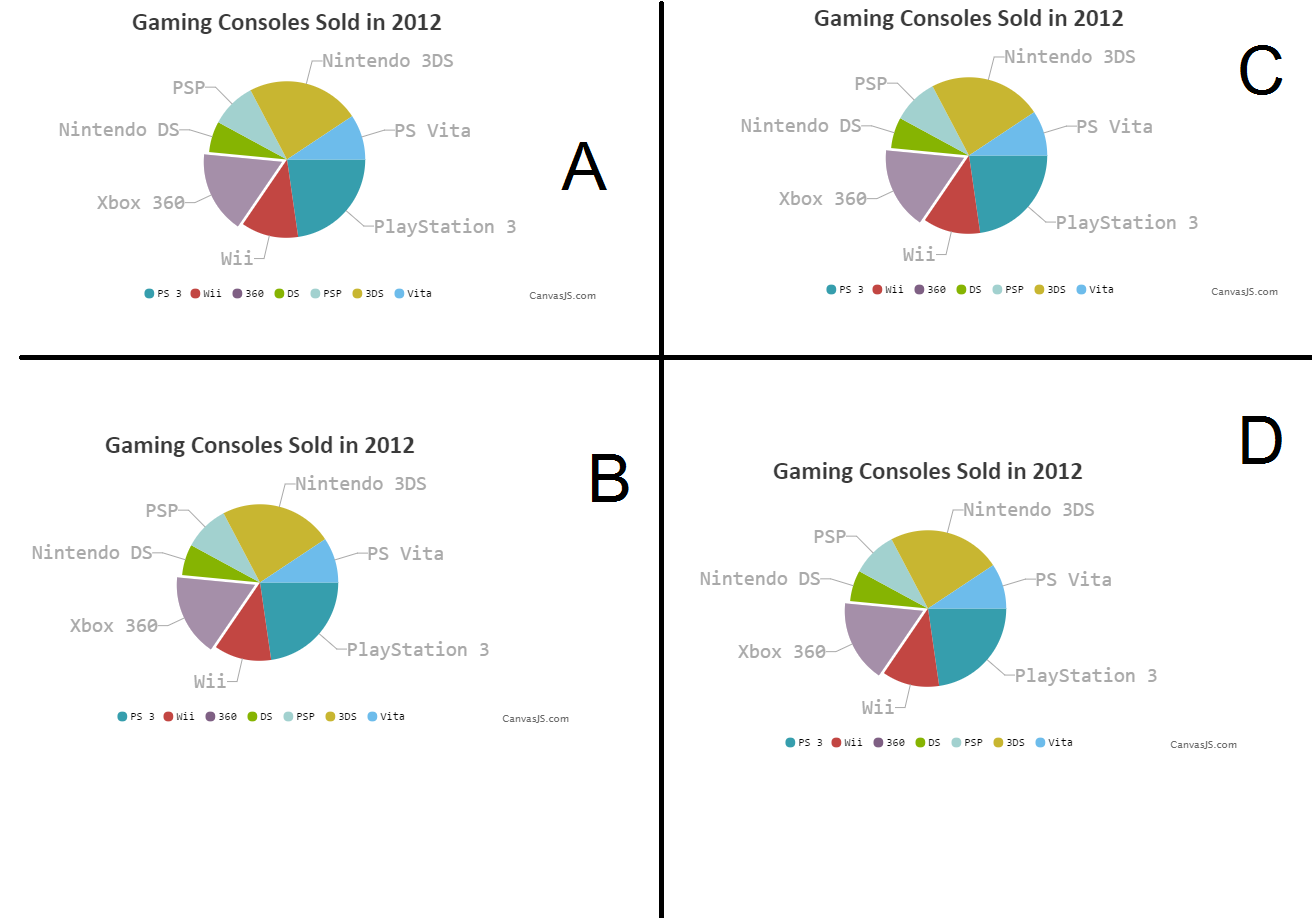
ผมต้องการสร้างกราฟแบบ
Code (PHP)
http://canvasjs.com/editor/?id=http://canvasjs.com/example/gallery/pie/gaming_conosle_share/
แต่ติดปัญหาอยู่ 2 อย่างครับ
1. ผมจะนำข้อมูลจากฐานข้อมูลมาวนลูป แทรกลงไปได้อย่างไรใน Code Java script
2. หลังจากวนรูปมาแล้ว ราฟ แบบ PIE จะมีประมาณ 5 กราฟ แต่ผมลองแล้ว มันสร้างให้แค่อันเดียวต่อหน้า เราต้องกำหนดหรือเขียนยังไงครับ ให้มันวนรูป กราฟ ตามจำนวนของข้อมูล
ขอบคุณ
*แนบ Code
Code (PHP)
<!DOCTYPE HTML>
<html>

<head>
<script type="text/javascript">
window.onload = function () {
	var chart = new CanvasJS.Chart("chartContainer",
	{
		title:{
			text: "Gaming Consoles Sold in 2012"
		},
                animationEnabled: true,
		legend:{
			verticalAlign: "bottom",
			horizontalAlign: "center"
		},
		data: [
		{
			indexLabelFontSize: 20,
			indexLabelFontFamily: "Monospace",
			indexLabelFontColor: "darkgrey",
			indexLabelLineColor: "darkgrey",
			indexLabelPlacement: "outside",
			type: "pie",
			showInLegend: true,
			toolTipContent: "{y} - <strong>#percent%</strong>",
			dataPoints: [
				{  y: 4181563, legendText:"PS 3", indexLabel: "PlayStation 3" },
				{  y: 2175498, legendText:"Wii", indexLabel: "Wii" },
				{  y: 3125844, legendText:"360",exploded: true, indexLabel: "Xbox 360" },
				{  y: 1176121, legendText:"DS" , indexLabel: "Nintendo DS"},
				{  y: 1727161, legendText:"PSP", indexLabel: "PSP" },
				{  y: 4303364, legendText:"3DS" , indexLabel: "Nintendo 3DS"},
				{  y: 1717786, legendText:"Vita" , indexLabel: "PS Vita"}
			]
		}
		]
	});
	chart.render();
}
</script>
<script type="text/javascript" src="/assets/script/canvasjs.min.js"></script>
</head>
<body>
<div id="chartContainer" style="height: 300px; width: 100%;"></div>
</body>
</html>
Tag : PHP, MySQL, HTML/CSS, JavaScript

|
|
|
 |
 |
 |
 |
| Date :
2016-07-11 12:32:36 |
By :
the_cop |
View :
3617 |
Reply :
7 |
|
 |
 |
 |
 |
|
|
|
|
 |
 |
|
 |
 |
 |
|
|
 |
 |
|
นำค่าที่ได้จากฐานข้อมูลของคุณมา ลูปเปลี่ยนค่าตรง
Code (PHP)
dataPoints: [
				{  y: 4181563, legendText:"PS 3", indexLabel: "PlayStation 3" },
				{  y: 2175498, legendText:"Wii", indexLabel: "Wii" },
				{  y: 3125844, legendText:"360",exploded: true, indexLabel: "Xbox 360" },
				{  y: 1176121, legendText:"DS" , indexLabel: "Nintendo DS"},
				{  y: 1727161, legendText:"PSP", indexLabel: "PSP" },
				{  y: 4303364, legendText:"3DS" , indexLabel: "Nintendo 3DS"},
				{  y: 1717786, legendText:"Vita" , indexLabel: "PS Vita"}
			]
ก็น่าจะได้แล้วนะครับ
|
 |
 |
 |
 |
| Date :
2016-07-11 13:58:04 |
By :
9nonameman |
|
 |
 |
 |
 |
|
|
 |
 |
|
 |
 |
 |
|
|
 |
 |
|
ผมลองแทรก Tag PHP เข้าไปแล้ว กราฟมันไม่ออกครับ
ผมอยากให้มันออกมาในรูปแบบนี้อะครับ
คือฐานข้อมูลผม มีข้อมูลประเภทสินค้า A B C D.....
อยากให้วนลูปจำนวนกราฟ ตามประเภทสินค้า...แล้วข้อมูลในแต่ละกราฟ ก็มาจากฐานข้อมูล
แต่ผมลองวนรูปแล้ว มันออกแค่กราฟเดียว ครับ

|
 |
 |
 |
 |
| Date :
2016-07-11 14:27:18 |
By :
the_cop |
|
 |
 |
 |
 |
|
|
 |
 |
|
 |
 |
 |
|
|
 |
 |
|
ตอนนี้ข้อมูลจากฐานข้อมูล แทรกเข้ามาได้แล้วครับ
เหลือเพียงแต่วนลูปกราฟตามประเภทครับ ลองเปลี่ยน ID กราฟก็ไม่ได้
   
|
 |
 |
 |
 |
| Date :
2016-07-11 15:54:54 |
By :
the_cop |
|
 |
 |
 |
 |
|
|
 |
 |
|
 |
 |
 |
|
|
 |
 |
|
มีโค้ดที่เขียนไหมครับ
|
 |
 |
 |
 |
| Date :
2016-07-11 16:11:53 |
By :
9nonameman |
|
 |
 |
 |
 |
|
|
 |
 |
|
 |
 |
 |
|
|
 |
 |
|
ตาม Code นี้เลยครับ
ซึ๋ง Code ถ้าวนลูป กราฟมันจะออก 1 กราฟ และออกกราฟข้อมูลสุดท้าย
Code (PHP)
<div class="row">
  <? $select_data=$mysqli->query("SELECT * FROM province");
                    $igraph=1;
                    while ($row_data=$select_data->fetch_assoc()){


?>
  <div class="col-md-4">
    <div class="block">
      <div class="block-heading">
        <div class="main-text h2">
          <?=$row_data[province_name];?>
        </div>
        <div class="block-controls"> <span aria-hidden="true" class="icon icon-cross icon-size-medium block-control-remove"></span> <span aria-hidden="true" class="icon icon-arrow-down icon-size-medium block-control-collapse"></span> </div>
      </div>
      <div class="block-content-outer">
        <div class="block-content-inner">
          <script type="text/javascript" src="graph/canvasjs.min.js"></script>
          <script type="text/javascript">
window.onload = function () {
	var chart= new CanvasJS.Chart("chartContainer<?=$igraph?>",
	{
		title:{
			text: ""
		},
		exportFileName: "Pie Chart",
		exportEnabled: true,
                animationEnabled: true,
		legend:{
			verticalAlign: "bottom",
			horizontalAlign: "center"
		},
		data: [
		{
			type: "pie",
			showInLegend: true,
			toolTipContent: "{label}: <strong>{y}</strong>",
			indexLabel: "{y}",


			dataPoints: [
                  <? $se_pos=$mysqli->query("SELECT * FROM pos_type");
                  while ($pos_data=$se_pos->fetch_assoc()){

                 $n1=$mysqli->query("SELECT * FROM staff WHERE province='$row_data[province_code]' and  pos_type ='$pos_data[postafftype_id]'");
	              $graph_total=$n1->num_rows;
                    ?>
			{  y:<?=$graph_total?>, legendText: "<?=$pos_data[postype_name]?>",  label: "<?=$pos_data[postafftype_name]?>" },
                <?}?>

			]


	}
	]
	});
	chartrender();
}

</script>

          <div id="chartContainer<?=$igraph?>" style="height: 300px; width: 100%;"></div>
        </div>
      </div>
    </div>
  </div>
  <? $igraph++; } ?>
</div>
|
ประวัติการแก้ไข
2016-07-11 16:26:52
2016-07-11 16:45:49
 |
 |
 |
 |
| Date :
2016-07-11 16:25:47 |
By :
the_cop |
|
 |
 |
 |
 |
|
|
 |
 |
|
 |
 |
 |
|
|
 |
 |
|
ผมคิดว่าคำสั่งในการสร้าง chart ควรอยู่ใน window.onload = function () ดูตามตัวอย่างด้านล่างนะครับ
อันนี้เหมือนกับของคุณ สร้าง window.onload มาทุกครั้งที่ลูป มันจะสร้าง chart ให้เฉพาะอันสุดท้าย
Code (PHP)
<!DOCTYPE HTML>
<html>
<head>
	<script src="js/canvasjs.min.js"></script>
	<title>CanvasJS Example</title>
</head>
<body>
<?php for($i=1;$i<=4;$i++){ ?>
		<script type="text/javascript">
			window.onload = function () {
				var chart<?php echo $i ?> = new CanvasJS.Chart("chartContainer<?php echo $i ?>",
				{
					theme: "theme2",
					title:{
						text: "Gaming Consoles Sold in 2012"
					},
					data: [
					{
						type: "pie",
						showInLegend: true,
						toolTipContent: "{y} - #percent %",
						yValueFormatString: "#0.#,,. Million",
						legendText: "{indexLabel}",
						dataPoints: [
							{  y: 4181563, indexLabel: "PlayStation 3" },
							{  y: 2175498, indexLabel: "Wii" },
							{  y: 3125844, indexLabel: "Xbox 360" },
							{  y: 1176121, indexLabel: "Nintendo DS"},
							{  y: 1727161, indexLabel: "PSP" },
							{  y: 4303364, indexLabel: "Nintendo 3DS"},
							{  y: 1717786, indexLabel: "PS Vita"}
						]
					}
					]
				});
				chart<?php echo $i ?>.render();
				chart<?php echo $i ?> = {};
			}
	</script>
	<div id="chartContainer<?php echo $i ?>" style="height: 400px; width: 100%;"></div>
 <?php } ?>
</body>
</html>
ส่วนอันนี้จะลูปสร้าง คำสั่งในการทำ chart ภายใน window.onload = function () ก่อน แล้วค่อยไปสร้าง div ตามจำนวน อีกที อันนี้ chart มาครบ นะครับ
Code (PHP)
<!DOCTYPE HTML>
<html>
<head>
	<script src="js/canvasjs.min.js"></script>
	<title>CanvasJS Example</title>
</head>
<body>
		<script type="text/javascript">
			window.onload = function () {
				<?php for($i=1;$i<=4;$i++){ ?>
				var chart<?php echo $i ?> = new CanvasJS.Chart("chartContainer<?php echo $i ?>",
				{
					theme: "theme2",
					title:{
						text: "Gaming Consoles Sold in 201<?php echo $i ?>"
					},
					data: [
					{
						type: "pie",
						showInLegend: true,
						toolTipContent: "{y} - #percent %",
						yValueFormatString: "#0.#,,. Million",
						legendText: "{indexLabel}",
						dataPoints: [
							{  y: 4181563, indexLabel: "PlayStation 3" },
							{  y: 2175498, indexLabel: "Wii" },
							{  y: 3125844, indexLabel: "Xbox 360" },
							{  y: 1176121, indexLabel: "Nintendo DS"},
							{  y: 1727161, indexLabel: "PSP" },
							{  y: 4303364, indexLabel: "Nintendo 3DS"},
							{  y: 1717786, indexLabel: "PS Vita"}
						]
					}
					]
				});
				chart<?php echo $i ?>.render();
				chart<?php echo $i ?> = {};
				<?php } ?>
			}
	</script>
	<?php for($i=1;$i<=4;$i++){ ?><div id="chartContainer<?php echo $i ?>" style="height: 400px; width: 100%;"></div><br><?php } ?>
</body>
</html>
|
 |
 |
 |
 |
| Date :
2016-07-12 08:11:32 |
By :
9nonameman |
|
 |
 |
 |
 |
|
|
 |
 |
|
 |
 |
|
|
| |

|
 Load balance : Server 01 Load balance : Server 01
|

