 |
วิทีการดึง MySql total จาก column รูปแบบนี้ทำยังไรหรอคับ |
| |
 |
|
|
 |
 |
|
SELECT a.Name , COUNT(a.NewUnPay)
FROM (SELECT Name , MIN(Unpay) As NewUnPay
	FROM table) As a
แบบ Sub Select ครับ
|
 |
 |
 |
 |
| Date :
2012-05-07 19:44:33 |
By :
mr.win |
|
 |
 |
 |
 |
|
|
 |
 |
|
 |
 |
 |
|
|
 |
 |
|
ขอบคุงคับ 
|
ประวัติการแก้ไข
2012-05-08 10:15:01
2012-05-08 10:26:25
 |
 |
 |
 |
| Date :
2012-05-08 09:27:03 |
By :
toojumbo |
|
 |
 |
 |
 |
|
|
 |
 |
|
 |
 |
 |
|
|
 |
 |
|
dt_district(อำเภอ) | dt_sex(เพศ)
เมืองลพบุรี หญิง
เมืองลพบุรี ชาย
เมืองลพบุรี ชาย
นอกเขตจังหวัด ชาย
ลำสนธิ ชาย
พัฒนานิคม ชาย
ชัยบาดาล หญิง
สระโบสถ์ หญิง
สระโบสถ์ ชาย
mysql อยากให้ผลลัพธ์ออกมาเป็น ผลรวมของ แต่ละอำเภอว่า
เมืองลพบุรี | ชาย(เท่าไหร่) | หญิง(เท่าไหร่)
สระโบสถ์ | ชาย(เท่าไหร่) | หญิง(เท่าไหร่)
**พอจะมีวิธีเขียนบ้างมั้ยคะ
|
 |
 |
 |
 |
| Date :
2012-05-14 15:12:58 |
By :
Duangrawee |
|
 |
 |
 |
 |
|
|
 |
 |
|
 |
 |
 |
|
|
 |
 |
|
ใช้แบบที่ผมเขียนให้เลยครับ ดัดแปลงนิดหน่อย
|
 |
 |
 |
 |
| Date :
2012-05-14 15:17:33 |
By :
mr.win |
|
 |
 |
 |
 |
|
|
 |
 |
|
 |
 |
 |
|
|
 |
 |
|
พี่รบกวนถามอีกนะค่ะ
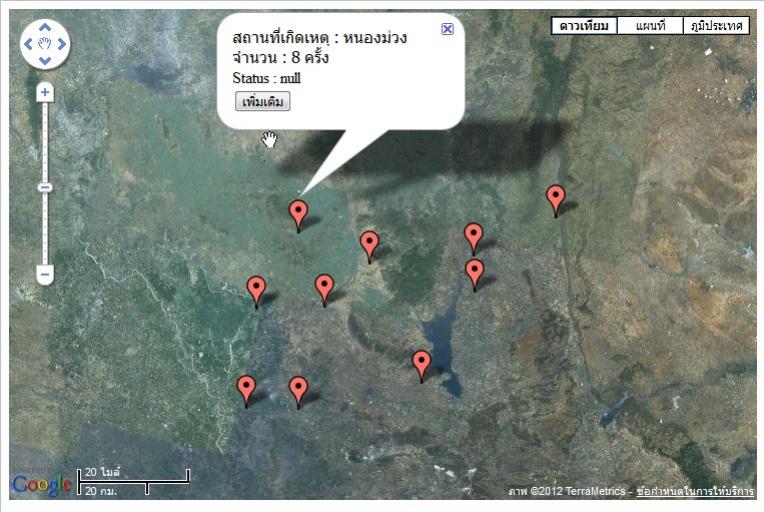
หนูทำโปรเจคเกี่ยวกับ ระบบจัดเก็บสถิติอุบัติเหตุผ่าน google map ประมาณว่าพอคลิกที่อำเภอนี้ แล้วก็เข้าคลิกปุ่มเพื่มเติม

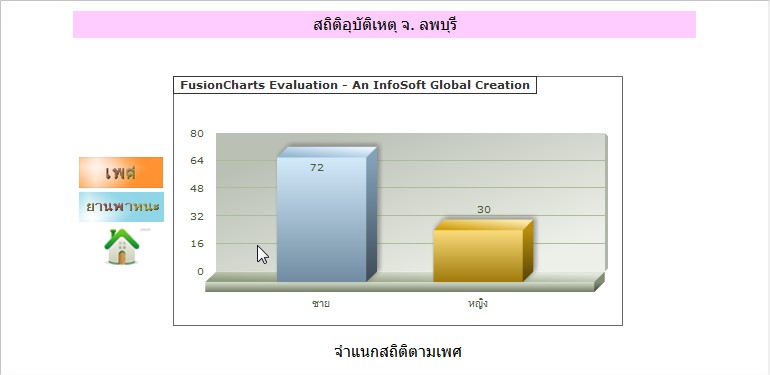
ก็จะเข้ามาดูสถิติของ ชาย และ หญิง ของเฉพาะอำเภอนี้เลย แต่หนูไม่รุว่าจะ echo ค่าออกมายังงัยค่ะรบกวนพี่ช่วยหน่อยนะคะ

อันนี้โค๊ดของกราฟที่แสดงผลของ สถิติ ชาย,หญิง คะ
Code (PHP)
<?php
//We've included ../Includes/FusionCharts.php and ../Includes/DBConn.php, which contains
//functions to help us easily embed the charts and connect to a database.
include("../Includes/FusionCharts.php");
include("../Includes/DBConn.php");
?>
<HTML>
<HEAD>
<TITLE>
สถิติจำแนกตามเพศ
</TITLE>
<?php
//You need to include the following JS file, if you intend to embed the chart using JavaScript.
//Embedding using JavaScripts avoids the "Click to Activate..." issue in Internet Explorer
//When you make your own charts, make sure that the path to this JS file is correct. Else, you would get JavaScript errors.
?>
<SCRIPT LANGUAGE="Javascript" SRC="../../FusionCharts/FusionCharts.js"></SCRIPT>
<style type="text/css">
<!--
body {
font-family: Arial, Helvetica, sans-serif;
font-size: 12px;
}
.text{
font-family: Arial, Helvetica, sans-serif;
font-size: 12px;
}
.style1 {font-size: 16px}
-->
</style>
</HEAD>
<BODY>
<form name="form1" method="post" action="">
<table width="627" height="266" border="0" align="center">
<tr>
<td height="27" colspan="3" bgcolor="#FFCCFF"><div align="center">
<p>สถิติอุบัติเหตุ จ. ลพบุรี</p>
</div></td>
</tr>
<tr>
<td width="104"> </td>
<td width="339" rowspan="3"><p align="center" class="style1"> </p>
<p align="center">
<?php
//In this example, we show how to connect FusionCharts to a database.
//For the sake of ease, we've used an MySQL databases containing two
//tables.
// Connect to the DB
$link = connectToDB();
//We also keep a flag to specify whether we've to animate the chart or not.
//If the user is viewing the detailed chart and comes back to this page, he shouldn't
//see the animation again.
$animateChart = $_GET['animate'];
//Set default value of 1
if ($animateChart=="")
$animateChart = "1";
//$strXML will be used to store the entire XML document generated
//Generate the chart element
$strXML = "<chart caption=' ' subCaption=' ' pieSliceDepth='30' showBorder='1' formatNumberScale='0' numberSuffix=' ' animation=' " . $animateChart . "'>";
// Fetch all factory records
// $strQuery = "select * from Factory_Master";
// $result = mysql_query($strQuery) or die(mysql_error());
$strQuery = "select t1.*,t2.women
FROM (SELECT dt_district, count(dt_district) as man FROM detail where dt_sex='ชาย' group by dt_district) as t1
left join
(SELECT dt_district, count(dt_district) as women FROM detail where dt_sex='หญิง' group by dt_district) as t2
on t1.dt_district=t2.dt_district";
$result2 = mysql_query($strQuery) or die(mysql_error());
//Iterate through each factory
if ($result2) {
while($ors2 = mysql_fetch_array($result2)) {
$strXML .= "<set label='" . $ors2['dt_sex'] . "' value='" . $ors2['c'] . "' />";
}
}
mysql_close($link);
//Finally, close <chart> element
$strXML .= "</chart>";
//Create the chart - Pie 3D Chart with data from strXML
echo renderChart("../../FusionCharts/Column3D.swf", "", $strXML, "FactorySum", 450, 250, false, false);
?>
|
 |
 |
 |
 |
| Date :
2012-05-14 20:07:45 |
By :
Duangrawee |
|
 |
 |
 |
 |
|
|
 |
 |
|
 |
 |
 |
|
|
 |
 |
|
ตั้งกระทู้ใหม่ครับน้อง 
|
 |
 |
 |
 |
| Date :
2012-05-14 20:19:41 |
By :
mr.win |
|
 |
 |
 |
 |
|
|
 |
 |
|
 |
 |
 |
|
|
 |
 |
|
ขอโทษนะค่ะที่ทำให้ไม่ค่อยเข้าใจ แต่พี่ช่วยดูให้เข้าใจหน่อยนะค่ะ
|
 |
 |
 |
 |
| Date :
2012-05-14 22:13:22 |
By :
Duangrawee |
|
 |
 |
 |
 |
|
|
 |
 |
|
 |
 |
 |
|
|
 |
 |
|
Mr.Win หมายถึงตั้งกระทู้ใหม่ให้เป็นเรื่องของคุณเองน่ะครับ จะได้ไม่ปนกับเรื่องภายในกระทู้นี้
|
 |
 |
 |
 |
| Date :
2012-05-15 01:09:16 |
By :
บังเอิญผ่านมาเห็น |
|
 |
 |
 |
 |
|
|
 |
 |
|
 |
 |
 |
|
|
 |
 |
|
เข้าใจแล้วค่ะขอบคุณมากเลยค่ะ
|
 |
 |
 |
 |
| Date :
2012-05-15 06:45:23 |
By :
Duangrawee |
|
 |
 |
 |
 |
|
|
 |
 |
|
 |
 |
 |
|
|
 |
 |
|
คุณ Duangrawee ติดต่อผมที่ Mail [email protected] หน่อยได้ไม๊ครับ
ผมสนใจแนวคิดงาน การแจ้งรายงานอุบัติเหตุ และกำลังทำอยู่เหมือนกัน..
เผื่อติดปัญหาเรื่องเดียวกันก็จะได้ถามกันได้ครับ. ตอนนี้เพิ่งเริ่มพัฒนาไปได้ไม่มาก แต่ละเอียดกว่าตัวนี้ยิบ ๆ หน่อยหนึ่ง แหะ ๆ เพราะทำใช้งานฟรีให้กับจังหวัดอยู่ครับ.
|
 |
 |
 |
 |
| Date :
2012-05-15 07:06:19 |
By :
deawx |
|
 |
 |
 |
 |
|
|
 |
 |
|
 |
 |
|
|