 |
|
จะใช้กราฟ highcharts แล้วได้ลองทำตามในnet ดูแล้วปรากฏว่า Chat ไม่ขึ้นค่ะ ไม่ทราบว่าตรงแก้ไขยังไงตรงไหนบ้างค่ะ
ขอบคุณค่ะCode (PHP)
<?php
//connect ฐานข้อมูล
$host = "localhost";
$user = "root";
$pwd = "";
$db = "test";
global $link;
$link = mysql_connect($host,$user,$pwd) or die ("Could not connect to MySQL");
mysql_query("SET NAMES UTF8",$link);
mysql_select_db($db,$link) or die ("Could not select $db database");

 $dormitory = array(); // ตัวแปรแกน x
 $id = array(); //ตัวแปรแกน y
//sql สำหรับดึงข้อมูล จาก ฐานข้อมูล
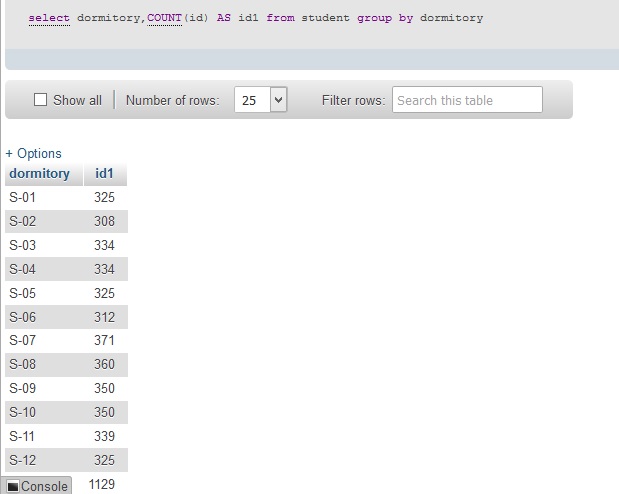
$sql ="select dormitory,COUNT(id) AS id1  from student group by dormitory";

//จบ sql

$result = mysql_query($sql);
while($row=mysql_fetch_array($result)) {

//array_push คือการนำค่าที่ได้จาก sql ใส่เข้าไปตัวแปร array
 array_push($dormitory,$row['dormitory']);
 array_push($id,$row['id1']);
}
?>
<!DOCTYPE HTML>
<html>
 <head>
  <meta http-equiv="Content-Type" content="text/html; charset=utf-8">
  <title></title>

        <script type="text/javascript" src="http://ajax.googleapis.com/ajax/libs/jquery/1.7.1/jquery.min.js"></script>
<script src="http://code.highcharts.com/highcharts.js"></script>
<script src="http://code.highcharts.com/modules/exporting.js"></script>
        <script>
 $(function () {
        $('#container').highcharts({
            chart: {
                type: 'column' //รูปแบบของ แผนภูมิ  line,bar,column,area
            },
            title: {
                text: '' //
            },
            xAxis: {

             categories: ['<?= implode(',', $dormitory); ?>']

            },
            yAxis: {
                title: {
                    text: 'ร้อยละ(%)'
                }
            },
             tooltip: {
                headerFormat: '<span style="font-size:10px">{point.key}</span><table>',
				pointFormat: '<tr><td style="color:{series.color};padding:0">{series.name}  </td>'+'<td style="padding:0"><b>{point.y:.lf} %</b></td></tr>',
				footerFormat: '</table>',
				shared: true,
				userHTML: true
            },
   legend: {
                            layout: 'vertical',
                            align: 'right',
                            verticalAlign: 'top',
                            x: -10,
                            y: 1000,
                            borderWidth: 1
            },
            plotOptions: {
                line: {
                    dataLabels: {
                        enabled: true
                    },
                    enableMouseTracking: false
                }
            },
            series: [{
                                name: 'คิดเป็น',

			     data: [<?= implode(',', $id) // ข้อมูล array แกน y ?>]
                            }]
        });
    });
        </script>

Tag : PHP, MySQL
|
|
|
 |
 |
 |
 |
| Date :
2016-12-10 20:06:02 |
By :
9759 |
View :
1710 |
Reply :
1 |
|
 |
 |
 |
 |
|
|
|
|
 |