<!DOCTYPE html>
<html>
<head>
<title>OrgChart Example</title>
<meta http-equiv="Content-Type" content="text/html; charset=utf-8" />
<link href="jquery.orgchart.css" media="all" rel="stylesheet" type="text/css" />
<style type="text/css">
#orgChart{
width: auto;
height: auto;
}
#orgChartContainer{
width: 1000px;
height: 500px;
overflow: auto;
background: #eeeeee;
}
</style>
</head>
<body>
<div id="orgChartContainer">
<div id="orgChart"></div>
</div>
<div id="consoleOutput">
</div>
<script type="text/javascript" src="jquery-1.11.1.min.js"></script>
<script type="text/javascript" src="jquery.orgchart.js"></script>
<script type="text/javascript">
var testData = [
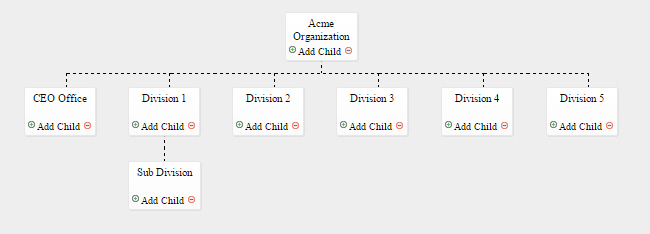
{id: 1, name: 'Acme Organization', parent: 0},
{id: 2, name: 'CEO Office', parent: 1},
{id: 3, name: 'Division 1', parent: 1},
{id: 4, name: 'Division 2', parent: 1},
{id: 6, name: 'Division 3', parent: 1},
{id: 7, name: 'Division 4', parent: 1},
{id: 8, name: 'Division 5', parent: 1},
{id: 5, name: 'Sub Division', parent: 3},
];
$(function(){
org_chart = $('#orgChart').orgChart({
data: testData,
showControls: true,
allowEdit: false,
onClickNode: function(node){
log('Clicked node '+node.data.id);
}
});
});
// just for example purpose
function log(text){
$('#consoleOutput').append('<p>'+text+'</p>')
}
</script>
</body>
</html>